Well boys, your CCO (Chief Content Officer) has done it again. From the man that brought you Weekly Matchups, The Month That Was, Keeper Delta, You’re Fired!, and The Commissioner’s Corner, comes the most advanced analytical sabermetric-y stat you’ve seen yet. Colin and Gentlemen, I give you...
*whooshing sound effects*
The Luck Factor
*Sound of an anvil falling*
For years we’ve toiled with outdated, inaccurate power rankings that don’t properly assess the gaps in category totals. Allow me to demonstrate; let’s take a look at the league totals for the Wins category this year. Conventional roto rankings would look like this:
Manager
|
Wins
|
Roto Points
|
Kurt
|
59
|
10
|
TJ
|
51
|
9
|
Colin
|
45
|
8
|
Richie
|
44
|
7
|
Jarrett
|
41
|
6
|
Alex
|
41
|
6
|
Ben
|
39
|
4
|
Tim
|
33
|
3
|
James
|
32
|
2
|
Adrian
|
32
|
2
|
Look at Kurt, lapping the field. Just dominating the shit out of this category. He would tally 10 roto points - and rightly so! But look past that. We’re saying that the gap between Kurt and TJ (8 wins) is the same as TJ and Colin (6 wins). The roto rankings lack precision. This was when I started to go Beautiful Mind on these numbers.
I’ve been striving to come up with a weighted power ranking system, but it always broke down when trying to incorporate the counting categories with the ratio categories. A poor journalism major such as myself couldn’t figure out the puzzle - until last week.
I needed a baseline, and found one in league averages. Then, I could get a better idea of how each of us fared in the categories. I could identify each team’s “market share” of the league totals, and give proper credit where it’s due.
Let’s go back to the Wins category and apply that logic:
Manager
|
Wins
|
League Avg
|
Kurt
|
59
|
+42%
|
TJ
|
51
|
+23%
|
Colin
|
45
|
+8%
|
Richie
|
44
|
+6%
|
Jarrett
|
41
|
-2%
|
Alex
|
41
|
-2%
|
Ben
|
39
|
-6%
|
Tim
|
33
|
-21%
|
James
|
32
|
-23%
|
Adrian
|
32
|
-23%
|
Now we’re working with something. Kurt’s dominance is accurately captured with a 21-percentage point difference over second place Tim, vs second place Tim’s 15-percentage point difference over third place Colin.
If we push this out to the rest of the categories, we get the following results:
Alright, there’s a lot to digest in there. Just keep in mind that 1.0 is the league average. Anything above 1.0 is above league average, anything below 1.0 is below league average. I also threw in some colors to easily identify areas of notable and extreme variance from the league average.
So after all those big words and boring math talk, here’s what you came here for:
Colin and TJ have earned their spots atop the DD thus far. Our lucky teams this year are Kurt, Jarrett, and Tim, who’s winning percentages are higher than expected based off of their team totals. Alex, James, and Ben have been unlucky and should have better records.
Let’s push this thing into overdrive. Go back to the examples from earlier with the Wins category. Remember how the weighted categories more accurately depicted the gap between our totals? Let’s keep running with that idea.
It’s easy to say that Tim has been luckier than Jarrett because Tim is 5 spots higher than his predicted spot, while Jarrett is only 2 spots higher than his predicted spot. But I think we can quantify this to see who's actually the luckiest and unluckiest.
If the 1.00 figure is the league average, that would stand to reason that 1.00 equates to a .500% winning percentage. So if we take the weighted totals and subtract .500 (I think that’s how it works):
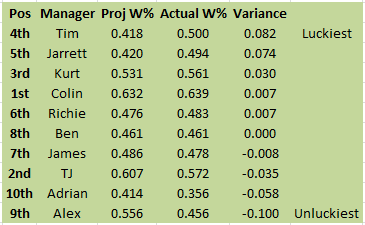
Boom. Here is your quantified luck so far from luckiest to unluckiest.
The Variance column is how far off of your expected winning percentage you are. Tim's winning percentage is .082 higher than expected, while Alex’s winning percentage is a full .100 lower than expected.
Not surprisingly, we can see that 5 of the managers in the top 6 have enjoyed some sort of luck this season and are winning more games than expected, based off their team stats. Colin’s .639 winning percentage, which would be second-best all time, is freaking legit. Alex projects to be a third place team but is wasting away in 9th from his rotten luck.
This doesn’t necessarily mean that we can expect regression from the lucky teams, or a comeback from the unlucky teams. The averages will change, players will get injured, and teams will look different. We'll check back in around the All-Star break to see how our luck has shifted!


No comments:
Post a Comment